Equinix
IBX SmartView, live monitoring for data centers
Equinix’s first SaaS product. Customers see the power, cooling, temperature and humidity of every cage they rent, in real time, across Equinix data centers. I was the lead designer from concept to pilot launch.
- Role
- Lead designer, with the design director
- Timeline
- Oct 2015 – Sep 2016 pilot
- Team
- 3 PMs, a content strategist, 2 business analysts, about 20 engineers
- Recognition
- Best IoT Application, NGON & Optical DCI Awards
Defining why
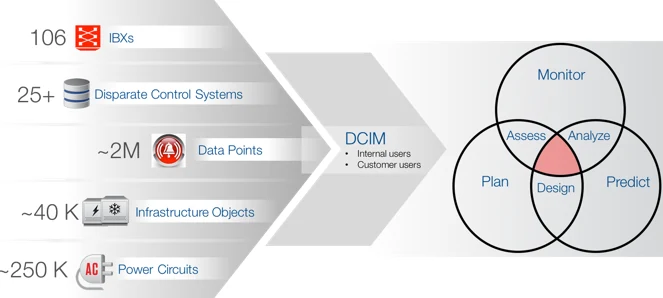
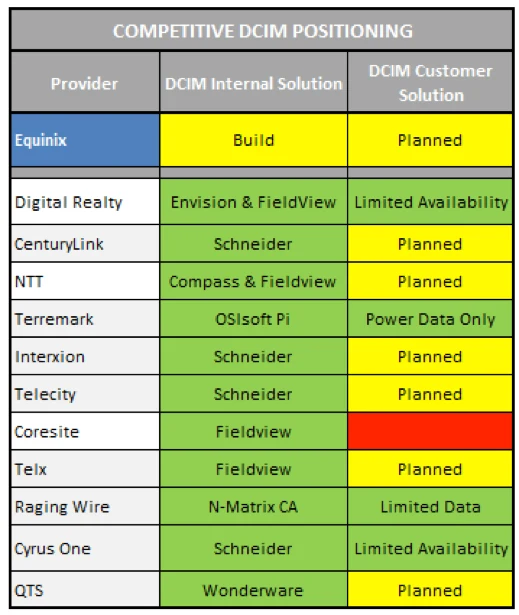
The decision to build a data center infrastructure management (DCIM) product had been made, but nobody could say exactly why, or for whom. That is where design came in.
We ran a two-day workshop with about eight teams to agree on a common goal. The strategy was about customer retention rather than direct revenue, and the product mattered for more than one reason: it was Equinix’s first SaaS business model, it gathered operational data in an IoT-like way, and it gave enterprises moving into colocation the visibility they were used to having in-house.
Listening to customers
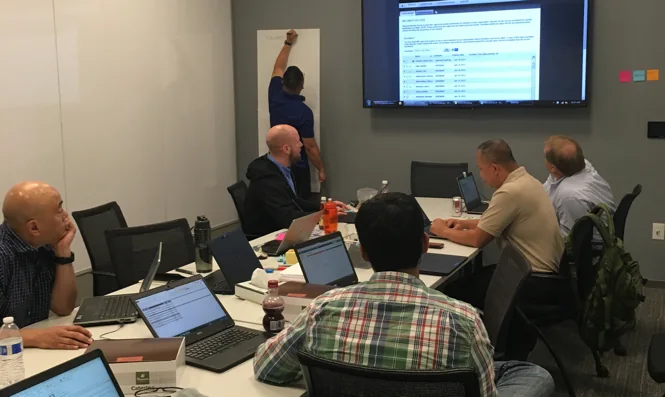
With product managers and analysts, I interviewed 30 customers who had shown interest in DCIM, 18 on site and 12 remotely: CIOs and IT managers, data center operators and engineers, and resellers.
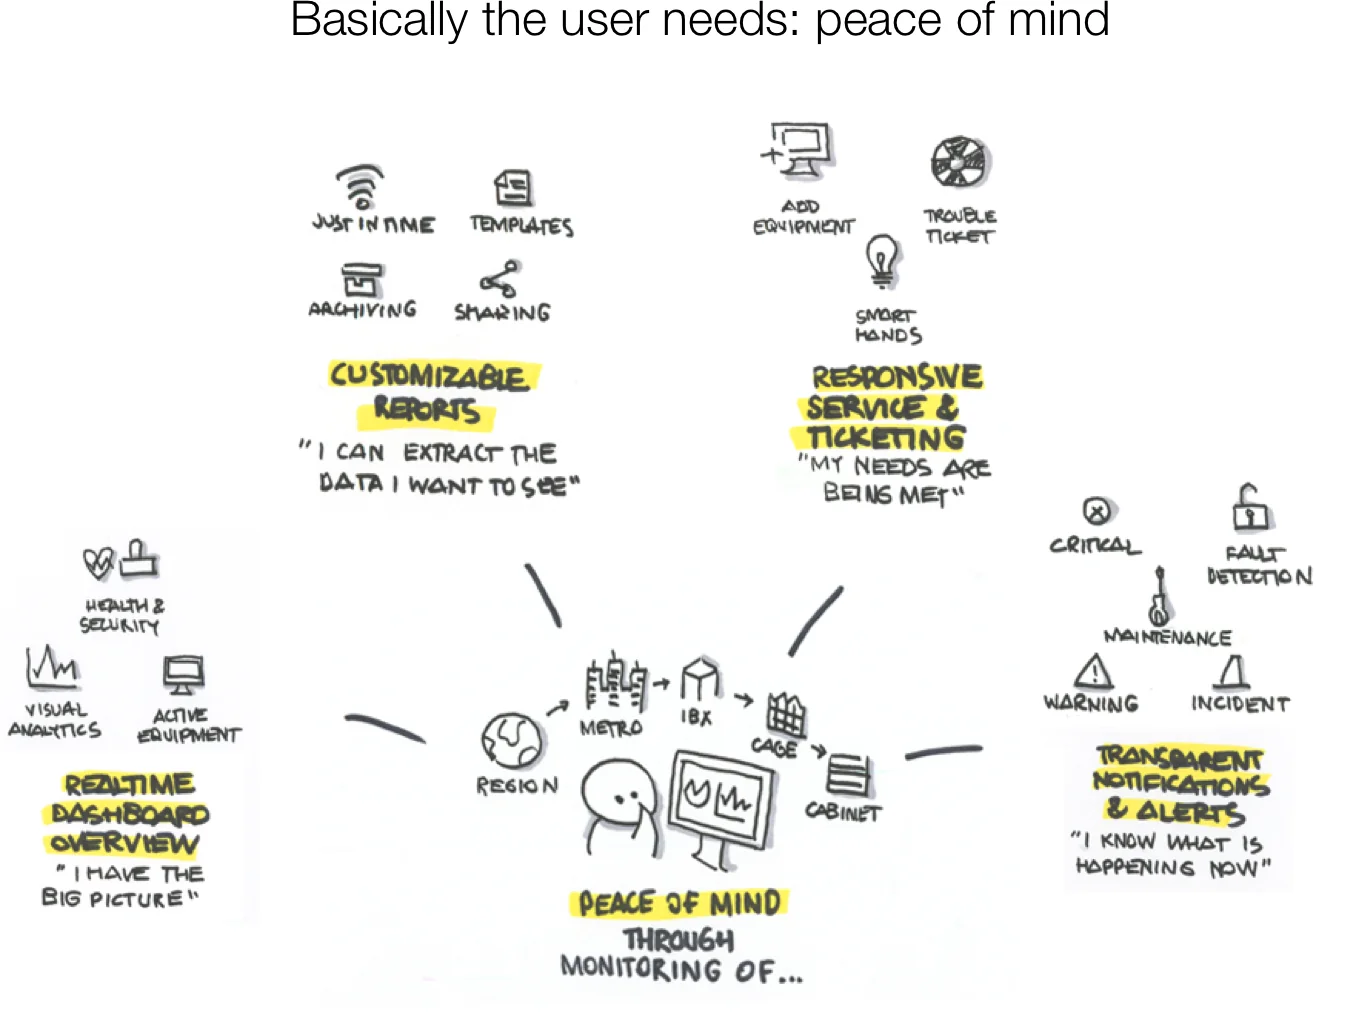
Two things came through clearly. Customers would pay more for information that was relevant to them, because too much data leads to confusion and then to no use at all. And power, cooling and network were the three things they cared about most.
Cage level data is most valuable.
Bank of AmericaIf it doesn’t impact us, it’s just noise.
SalesforceCustomizable alerts are critical.
LinkedIn
Scoping the MVP
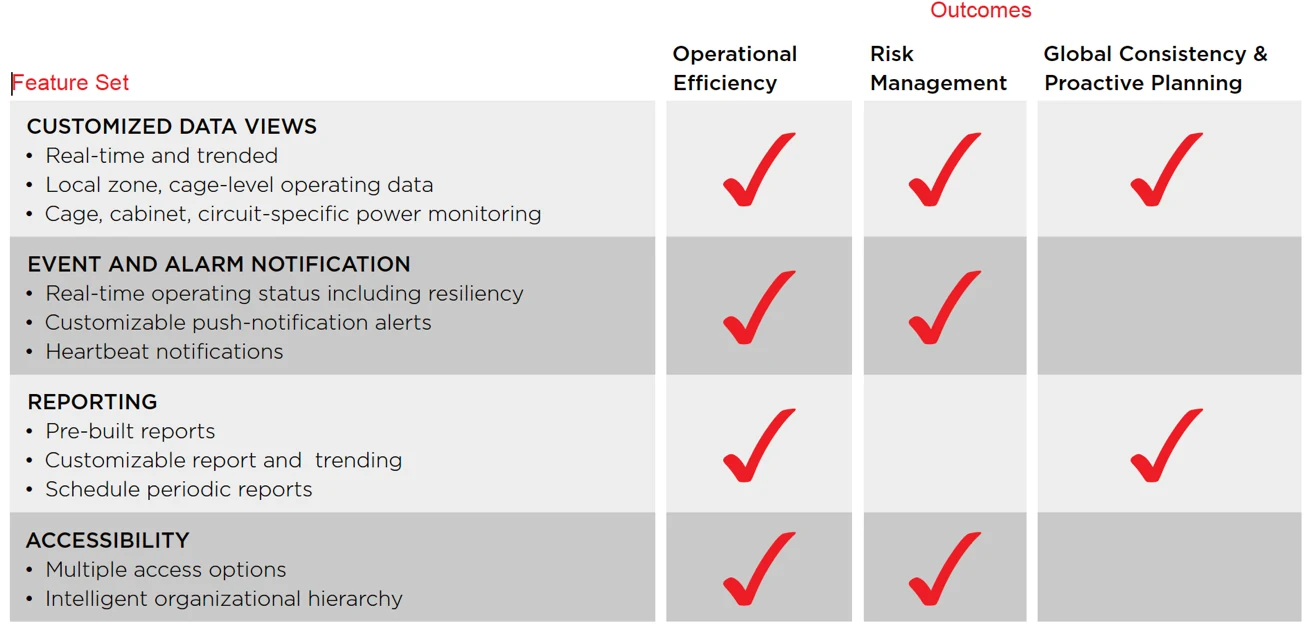
Synthesis showed a clear gap between what customers expected and what we could deliver in time. In a second workshop we agreed to build an MVP: the most impactful features, in the six data centers with the highest concentration of target customers. Product, design and engineering ranked features together on a 2×2.
Designing it
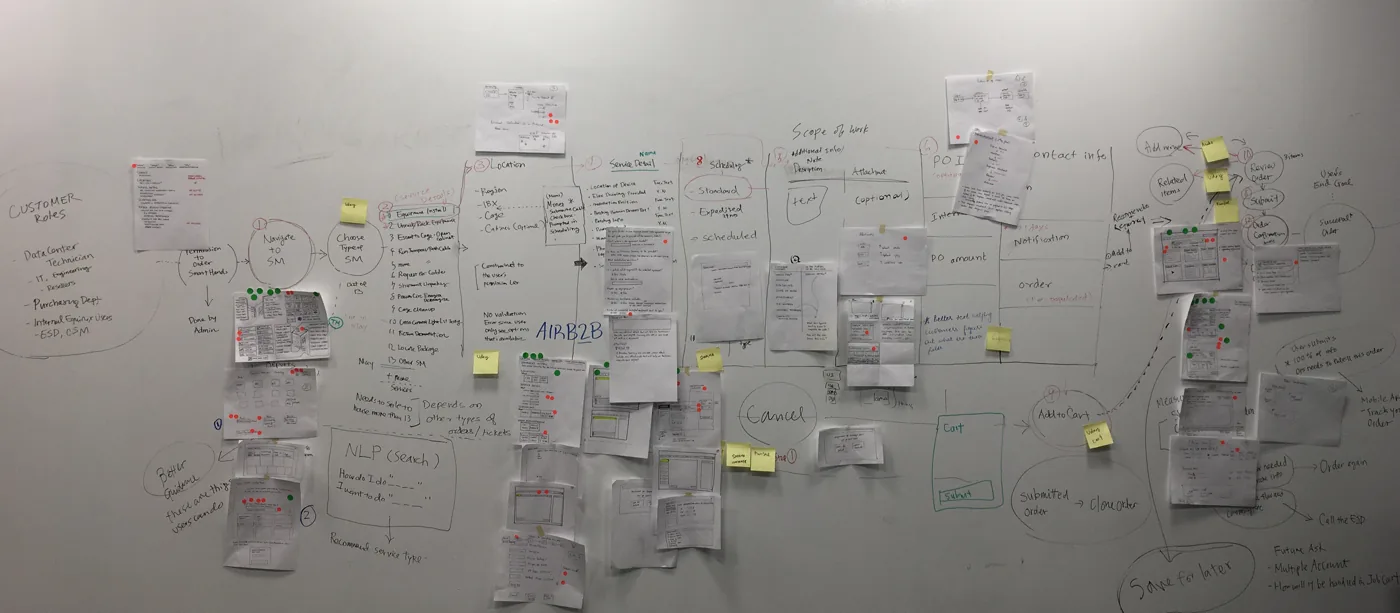
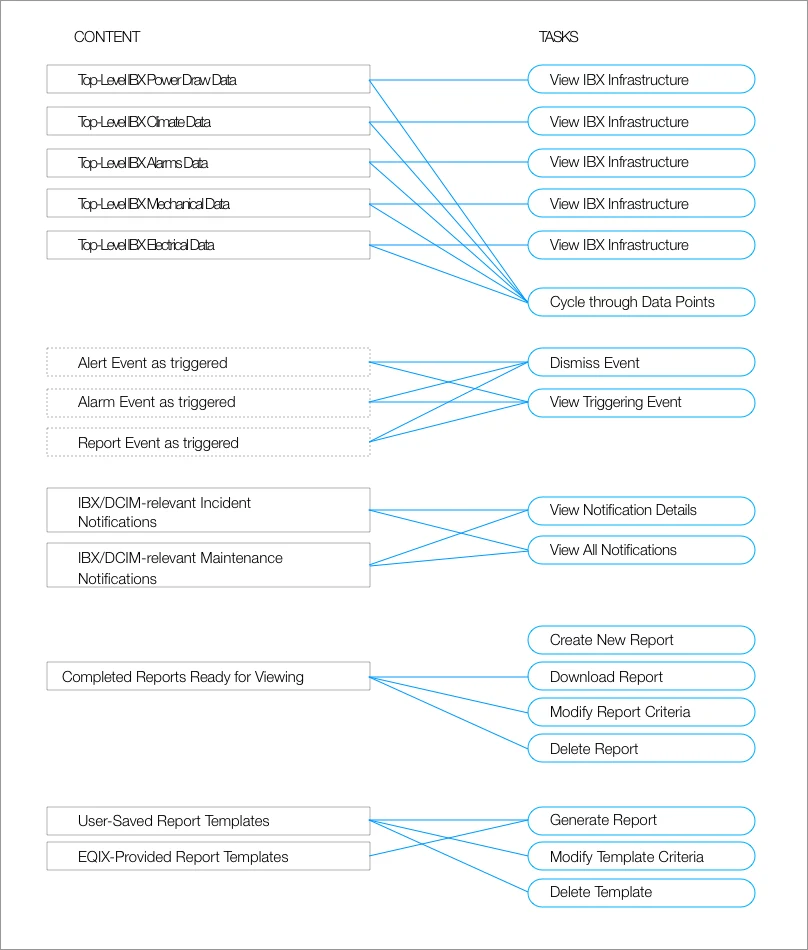
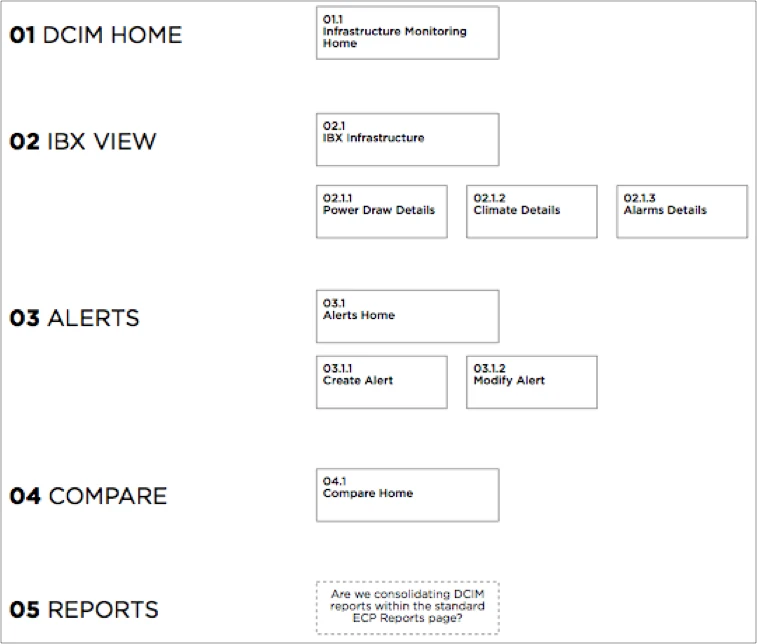
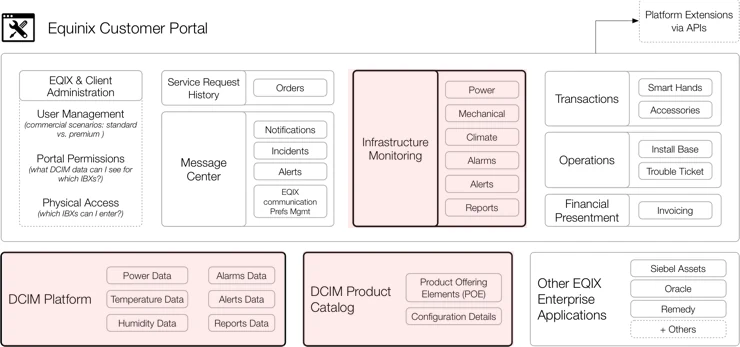
SmartView would live inside the existing customer portal, so the structure had to be right before anything else. I mapped every task to the content it needed, drew a reference architecture with the existing products, and laid out the information architecture.
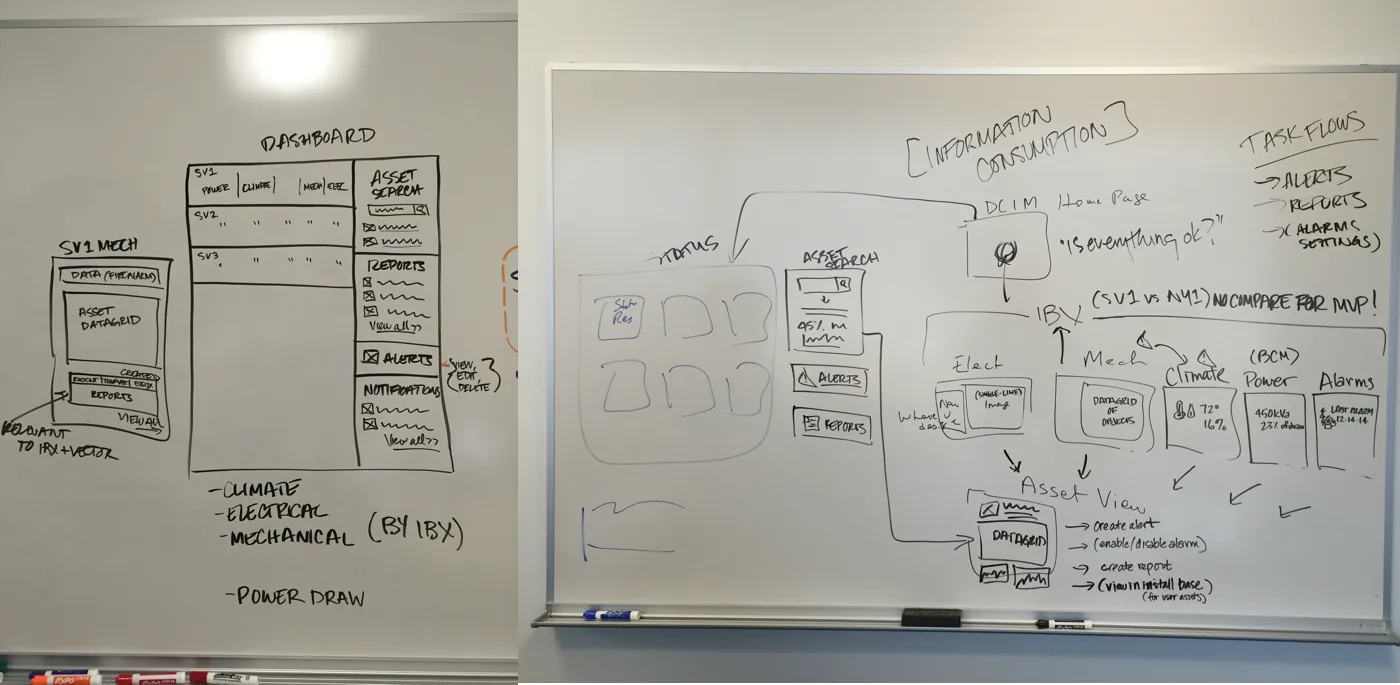
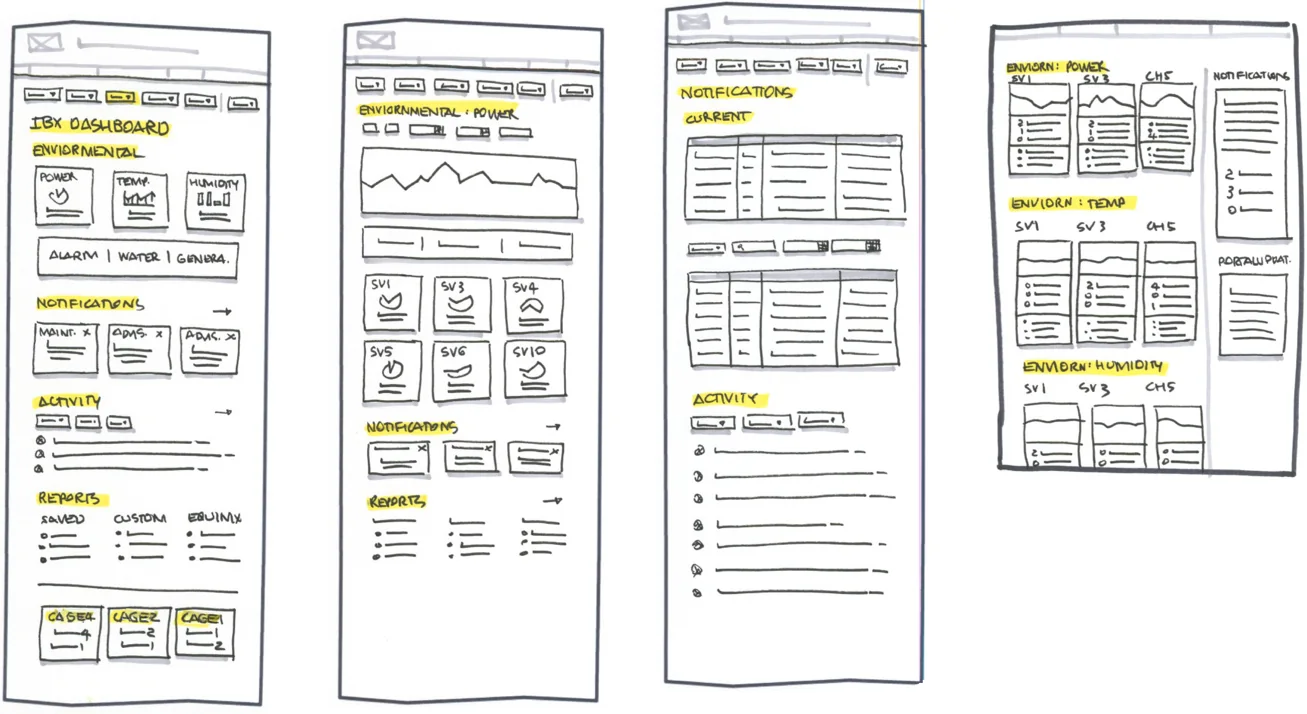
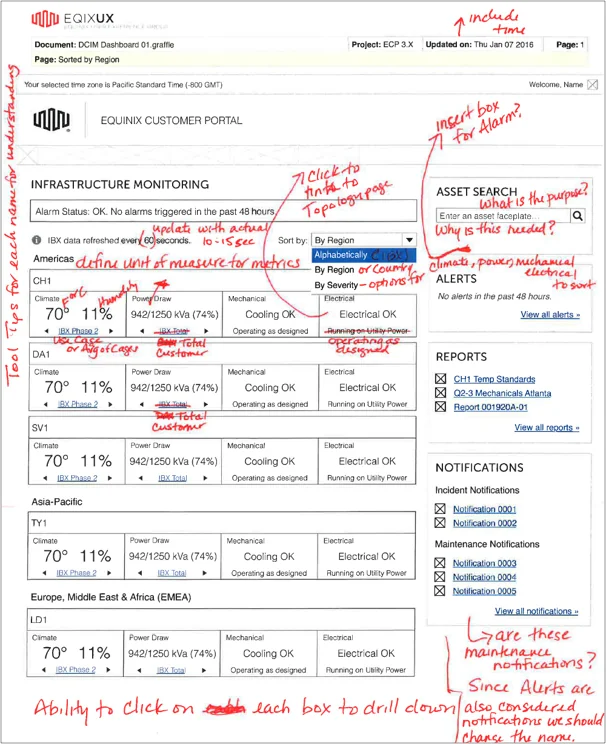
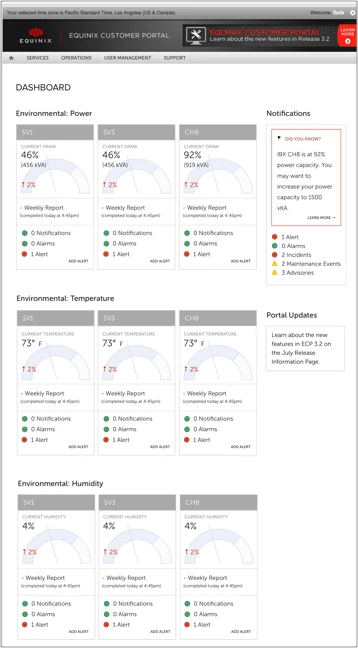
From there: whiteboarding with PMs and analysts, sketches, then wireframes. We tested two directions remotely with internal users over three days, and gathered quick pen-and-paper feedback from stakeholders between rounds.
The product
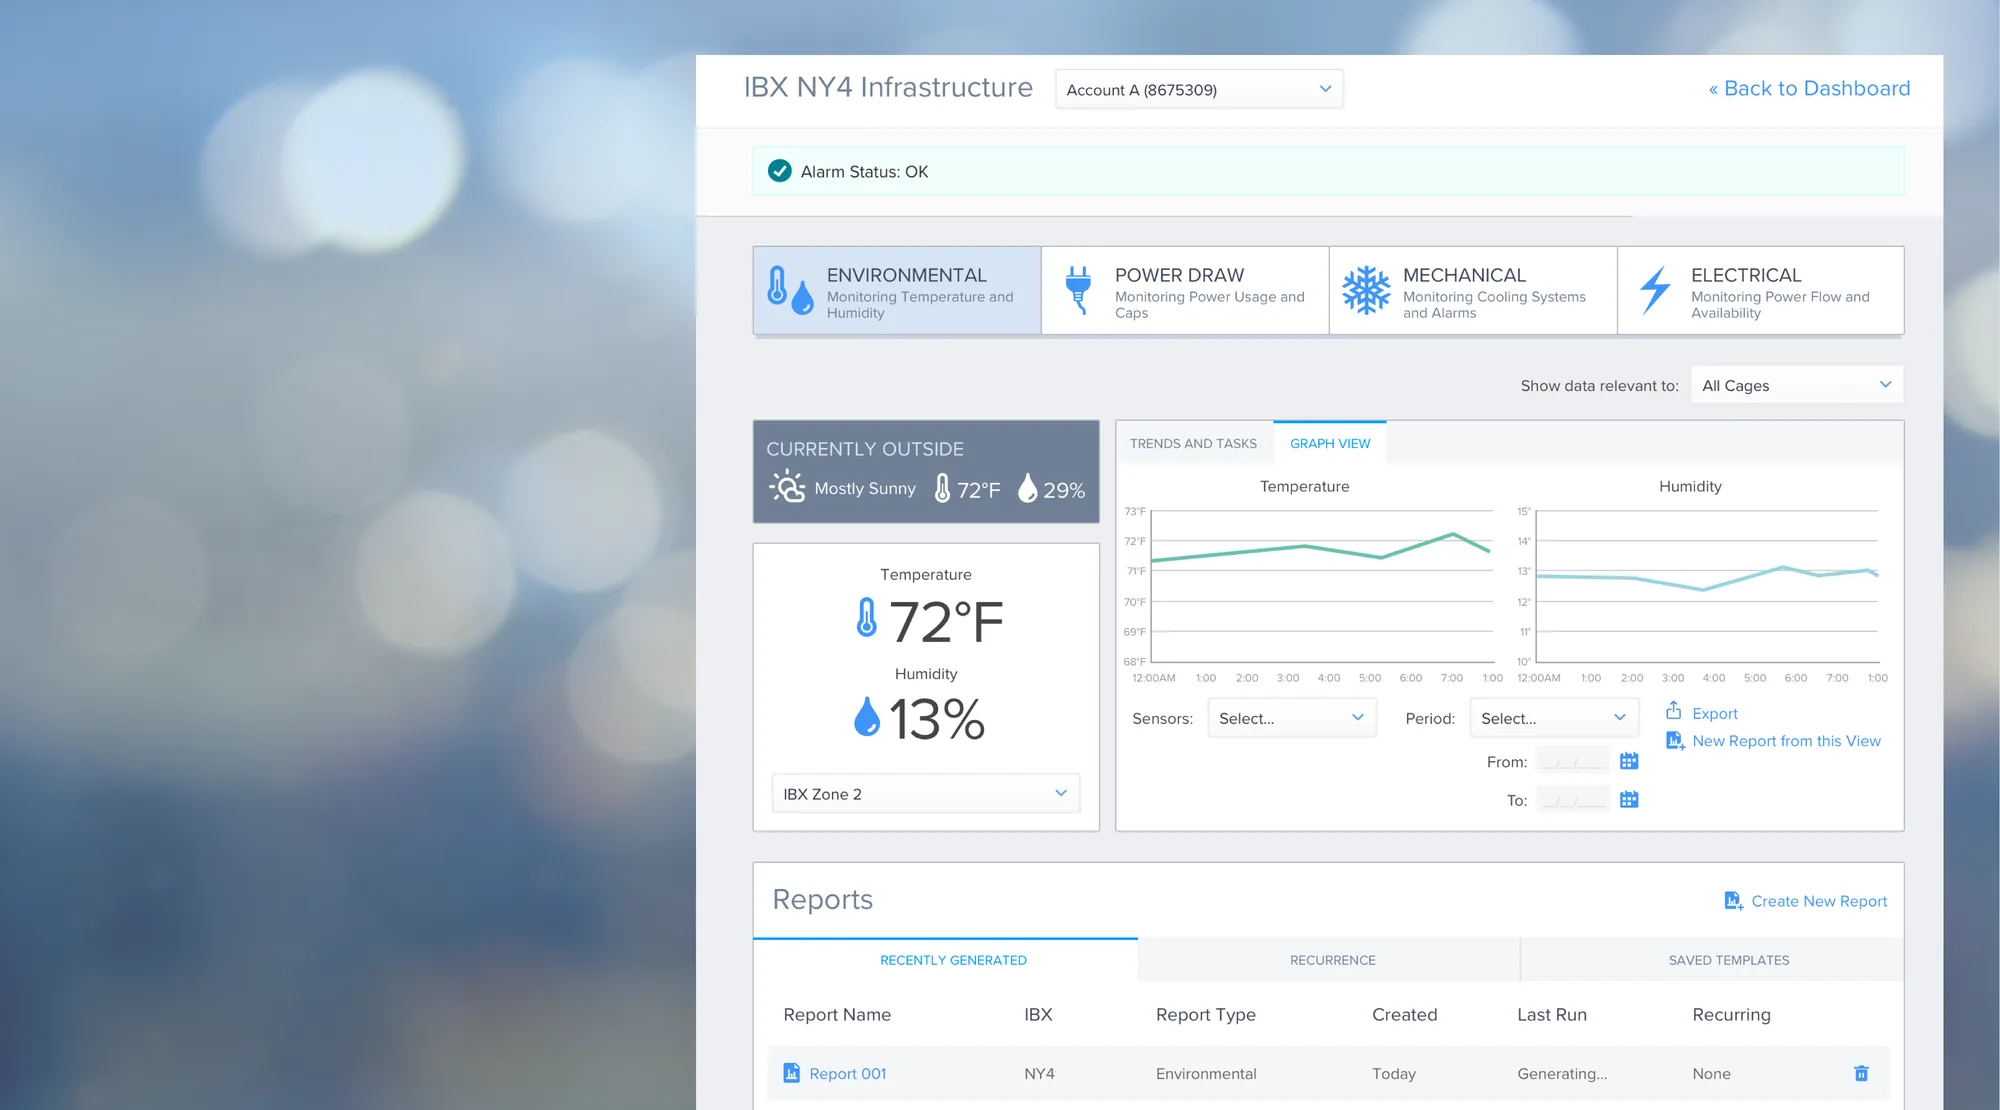
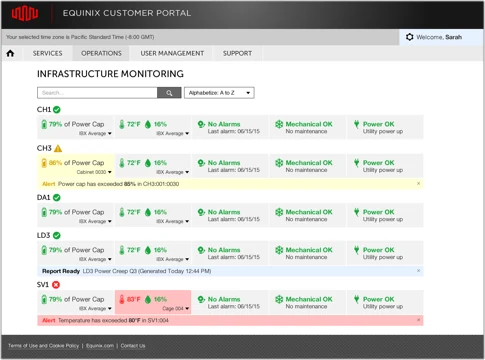
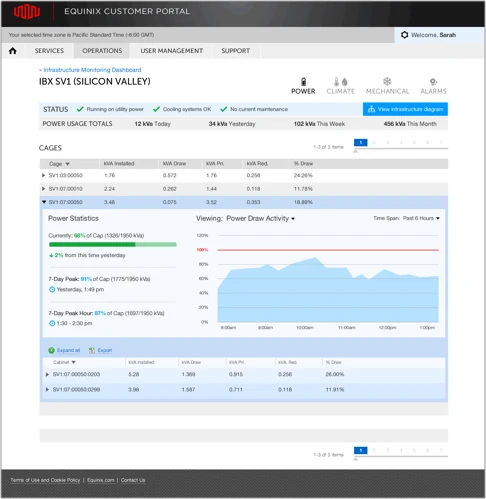
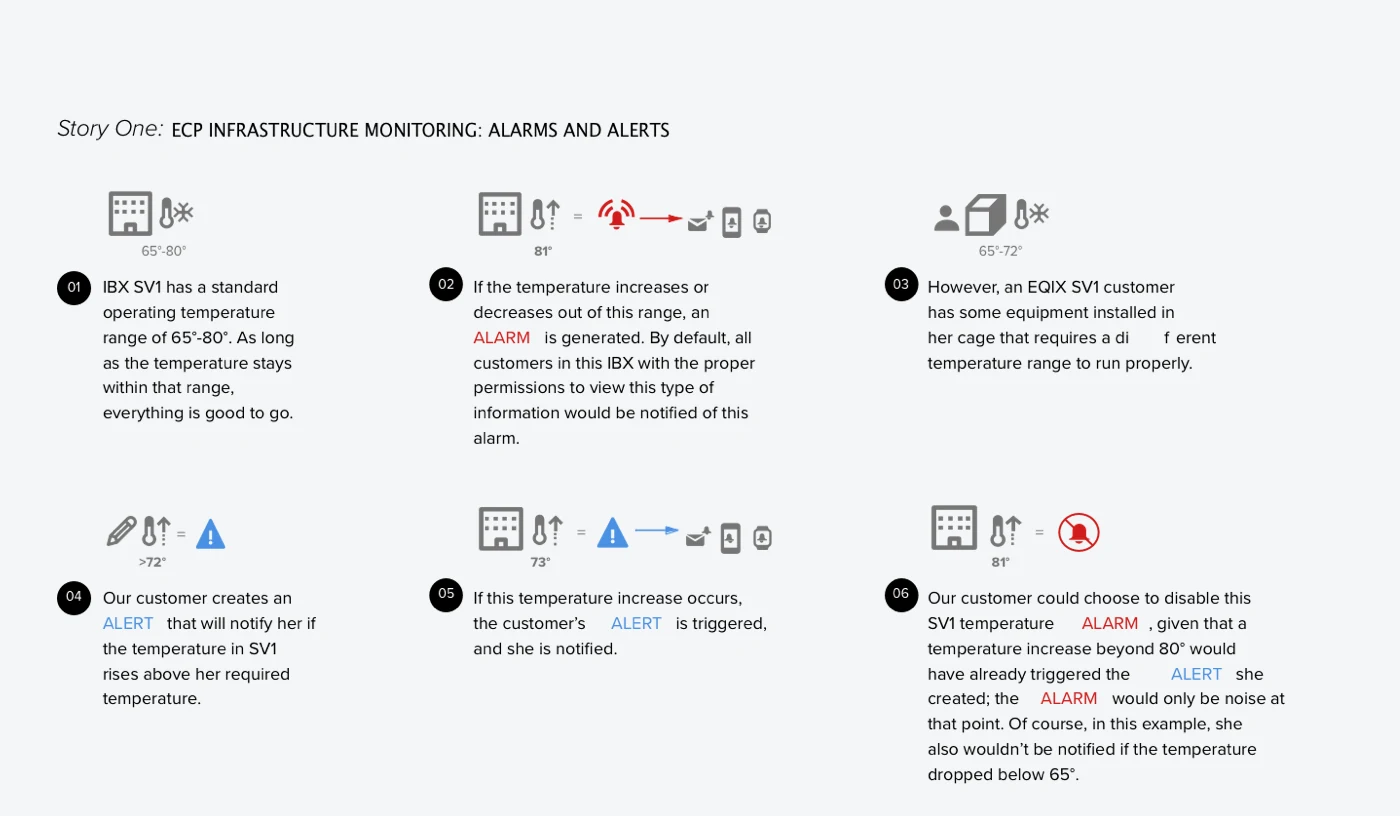
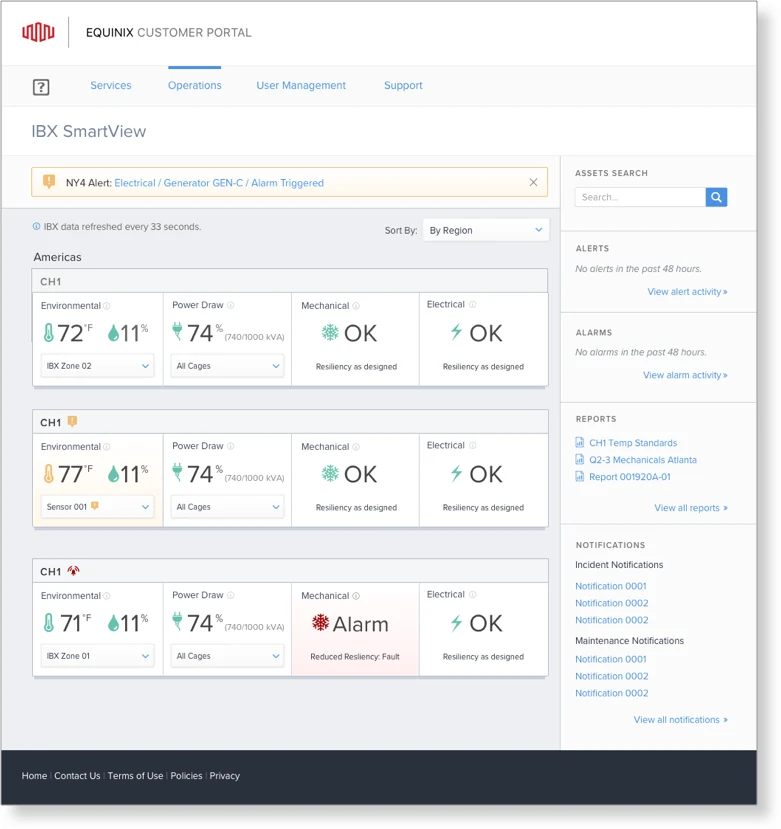
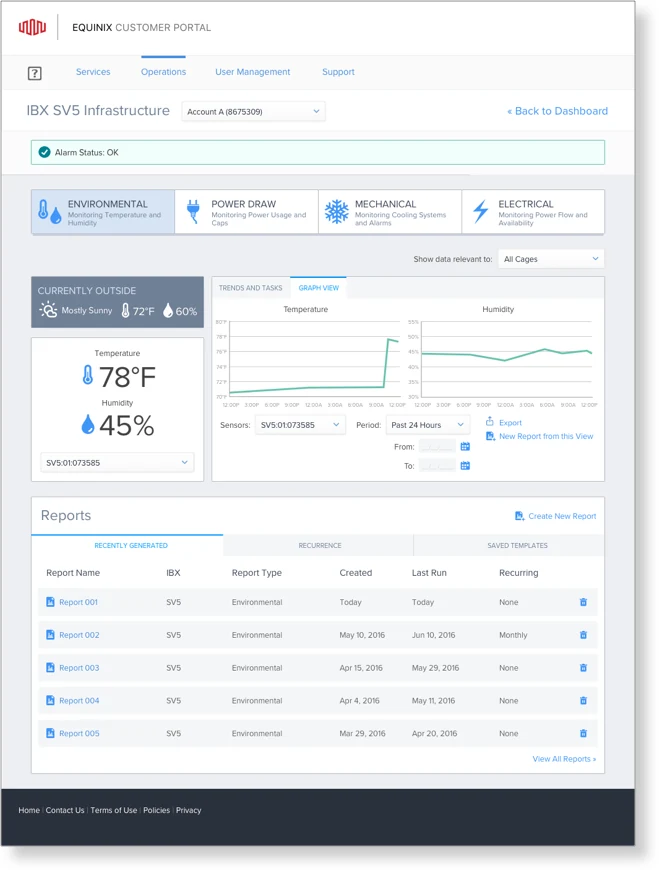
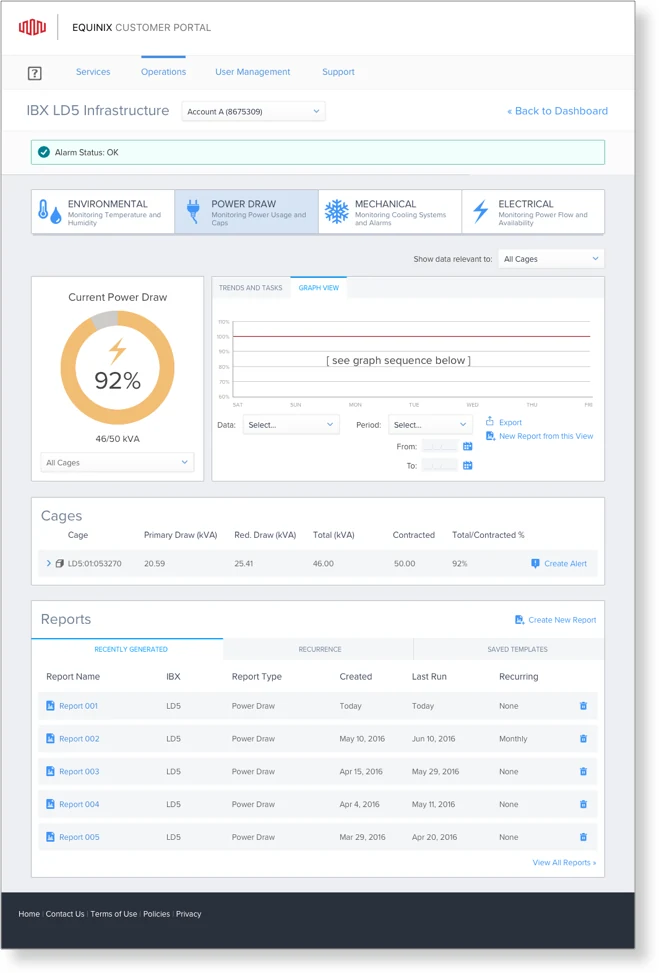
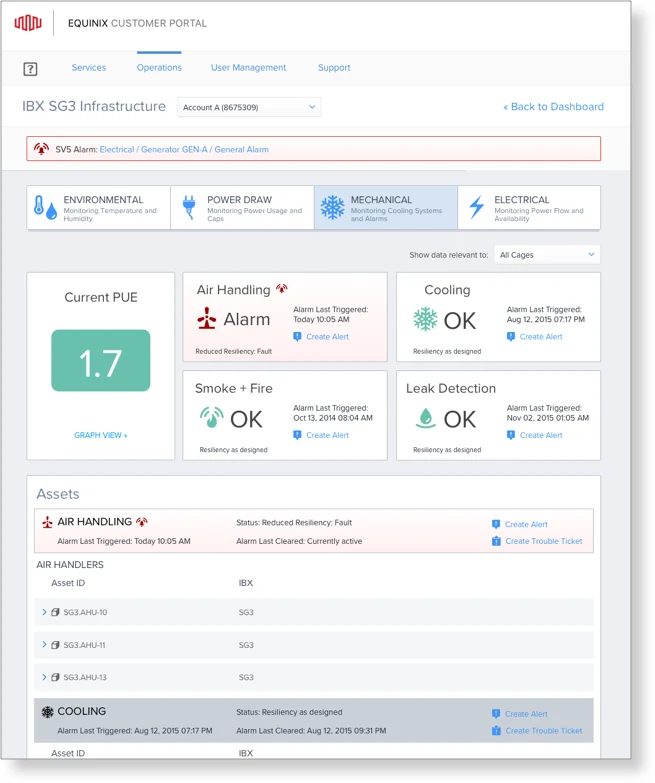
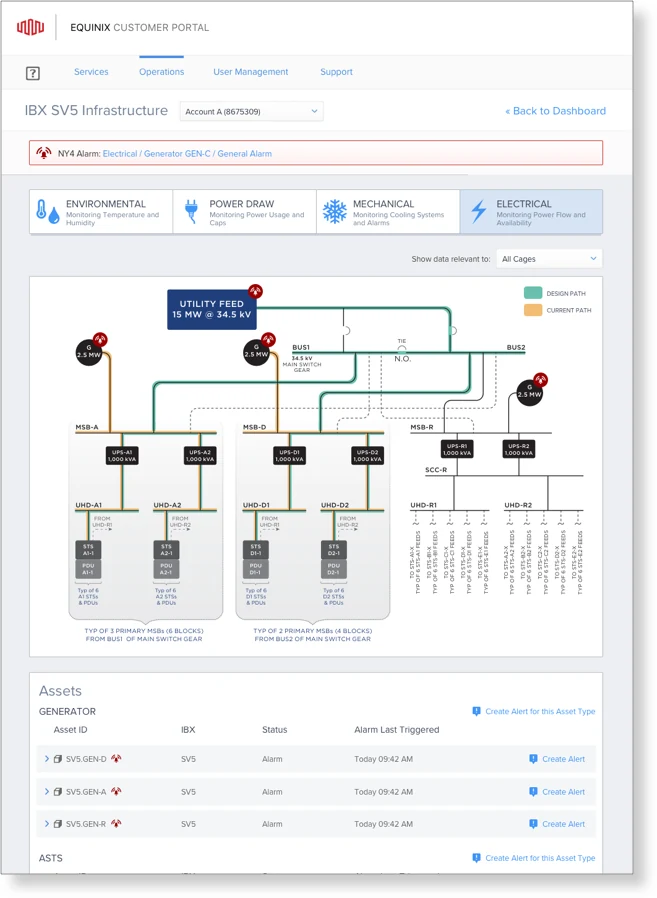
A customizable dashboard shows the current state of every location, with color and icons signaling alerts and alarms, and shortcuts into the detail. From there, four views: environmental (temperature and humidity by cage and cabinet), power draw, mechanical (HVAC, chillers, fire and water systems) and electrical (every level of redundancy from circuit to UPS).
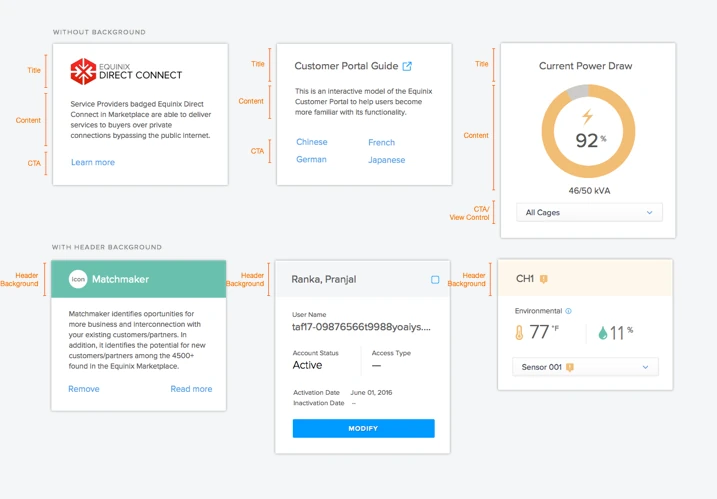
The visual system had to fit the customer portal’s existing patterns while serving a new kind of data, so I extended the style guide with new components and alert patterns.
Launch and impact
As soon as the prototype was ready we put it in front of our top customers, who had been waiting for it. The feedback was very positive; the only requests were for features outside the MVP.
Pretty useful to see the power pathways as well as trending available on the environmentals.
PandoraI like how Equinix is taking the lead in this area to provide customers real time data.
Amazon Web Services
- Top 3customers paying for it
- 43%of customers using the free view
- +8%usage growth every quarter
- 0support tickets in the pilot

What I learned
An MVP is the right way into a product this complex. Cutting the feature list to what was technically possible, and shipping a pilot, got us live on time and taught us what the next releases needed. Nine more data centers were scheduled to follow.
Simplicity is not easy. It takes many iterations to make a product simple, easy and functional.
From my notes at the end of the project